AppleTrace Performance Analysis Tool
(Related article: https://everettjf.github.io/2017/10/12/appletrace-dancewith-monkeydev/ )
Background
Normally using Instruments (mainly Time Profiler) for iOS App performance analysis is sufficient, but Time Profiler merges all calling methods together, losing temporal representation. Until one day saw Android development colleagues using systrace for performance analysis, systrace generates an html file, displaying function (method) call time consumption in chronological order. Thought: if iOS had such a tool would be great. Learned this html file is generated by catapult.
One day saw iosre forum a post about hook objc_msgSend. Suddenly thought, can combine catapult to generate Objective C method performance analysis chart (let’s call it that for now). (Although there were always methods to hook objc_msgSend, but this time the ready-made delicacy finally couldn’t resist).
Said do it and started, paused a few days developing MachOExplorer. Recently been using very limited spare time to develop MachOExplorer at snail’s pace, but now seeing generating performance analysis chart is more important, recalling past hard overtime work, if could generate this performance analysis chart, wouldn’t have solved problems quickly then.
Goal
Hook all objc_msgSend, that is calculate each Objective C method’s time consumption, and generate performance analysis chart in chronological order.
Problems to Solve
How to Generate Final html
From here can learn how catapult generates html. One way can be: Chrome’s trace_event format. Simply put, trace_event format is a json format, after filling data according to this agreed json format, can use trace2html command (python script) to convert to final html file.
$CATAPULT/tracing/bin/trace2html my_trace.json --output=my_trace.html && open my_trace.html
How to Hook objc_msgSend
See article Using HookZz to Quickly Reverse Engineer (Hack objc_msgSend) to Clarify Logic
HookZz is a micro hook framework developed by jmpews, very flexible to use. See details https://jmpews.github.io/zzpp/
How to Generate trace_event format json File
Reference document Chrome’s trace_event format can learn, simplest json file can be:
[ {"name": "Asub", "cat": "PERF", "ph": "B", "pid": 22630, "tid": 22630, "ts": 829},
  {"name": "Asub", "cat": "PERF", "ph": "E", "pid": 22630, "tid": 22630, "ts": 833} ]
Each line represents an Event,
{
  "name": "myName",
  "cat": "category,list",
  "ph": "B",
  "ts": 12345,
  "pid": 123,
  "tid": 456,
  "args": {
    "someArg": 1,
    "anotherArg": {
      "value": "my value"
    }
  }
}
Each field’s meaning:
- name: The name of the event, as displayed in Trace Viewer
- cat: The event categories. This is a comma separated list of categories for the event. The categories can be used to hide events in the Trace Viewer UI.
- ph: The event type. This is a single character which changes depending on the type of event being output. The valid values are listed in the table below. We will discuss each phase type below.
- ts: The tracing clock timestamp of the event. The timestamps are provided at microsecond granularity.
- tts: Optional. The thread clock timestamp of the event. The timestamps are provided at microsecond granularity.
- pid: The process ID for the process that output this event.
- tid: The thread ID for the thread that output this event.
- args: Any arguments provided for the event. Some of the event types have required argument fields, otherwise, you can put any information you wish in here. The arguments are displayed in Trace Viewer when you view an event in the analysis section.
ph (event type) is what needs attention:
| Event type | Event phases |
|---|---|
| Duration Events | B(begin), E(end) |
| … | … |
That is a method call, needs at least two lines, ph=B and ph=E.
After format is clear, need to generate json file. Generating this json file is essentially a logging function, to minimize impact on App’s performance, use memory mapping mmap method to write file. Also to simply handle multi-threading issues, use serial queue. Code see here
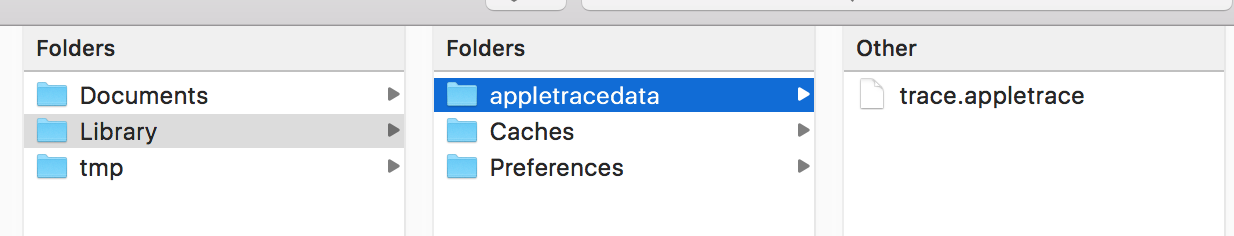
Final trace file will be generated in App sandbox’s Library/appletracedata directory. Since log volume may be large, combined with mmap’s characteristics, log files will be generated with following logic:
trace.appletrace
trace_1.appletrace
trace_2.appletrace
trace_3.appletrace
...
trace_N.appletrace
Each appletrace file is 16MB, due to mmap’s characteristics (can only map fixed size files), file end generally has \0 for padding.
After generating these appletrace files, need to copy from App’s sandbox. Use merge.py to convert appletrace files to trace_event format json file.
python merge.py -d <appletracedata directory>
Finally execute catapult’s trace2html script, generate final html file.
python catapult/tracing/bin/trace2html appletracedata/trace.json --output=appletracedata/trace.html
Source Code
https://github.com/everettjf/AppleTrace
Usage
Collect Data
Currently there are two ways to collect data.
Manual APTBeginSection and APTEndSection
This scenario is: I don’t want to hook all Objective C methods, I only want when analyzing performance, manually add start point and end point bit by bit. (Android’s systrace also supports this) Although troublesome, but after locating general direction, this is more precise and accurate, avoiding hook’s impact on App’s own performance.
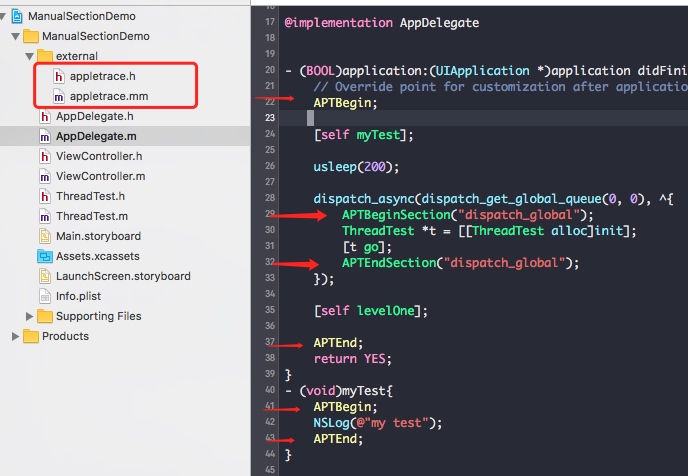
(1) Just drag appletrace.h and appletrace.mm files into your project. (Of course can make this CocoaPods, will do when there’s time).
(2) Then at function (method)’s beginning and end (or intervals you’re interested in), call APTBeginSection and APTEndSection. For ObjectiveC methods can use macros APTBegin and APTEnd.
// Objective C class method
#define APTBegin APTBeginSection([NSString stringWithFormat:@"[%@]%@",self,NSStringFromSelector(_cmd)].UTF8String)
#define APTEnd APTEndSection([NSString stringWithFormat:@"[%@]%@",self,NSStringFromSelector(_cmd)].UTF8String)
Reference example sample/ManualSectionDemo.
Hook objc_msgSend
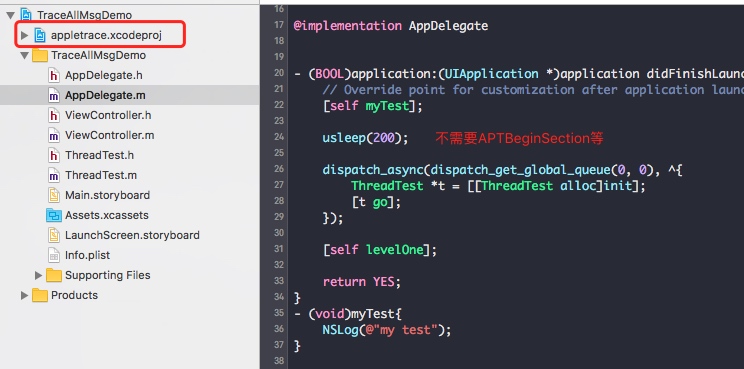
This scenario is: I want to initially locate where there are time-consuming operations, can hook objc_msgSend once overall, get a general understanding of entire App’s flow.
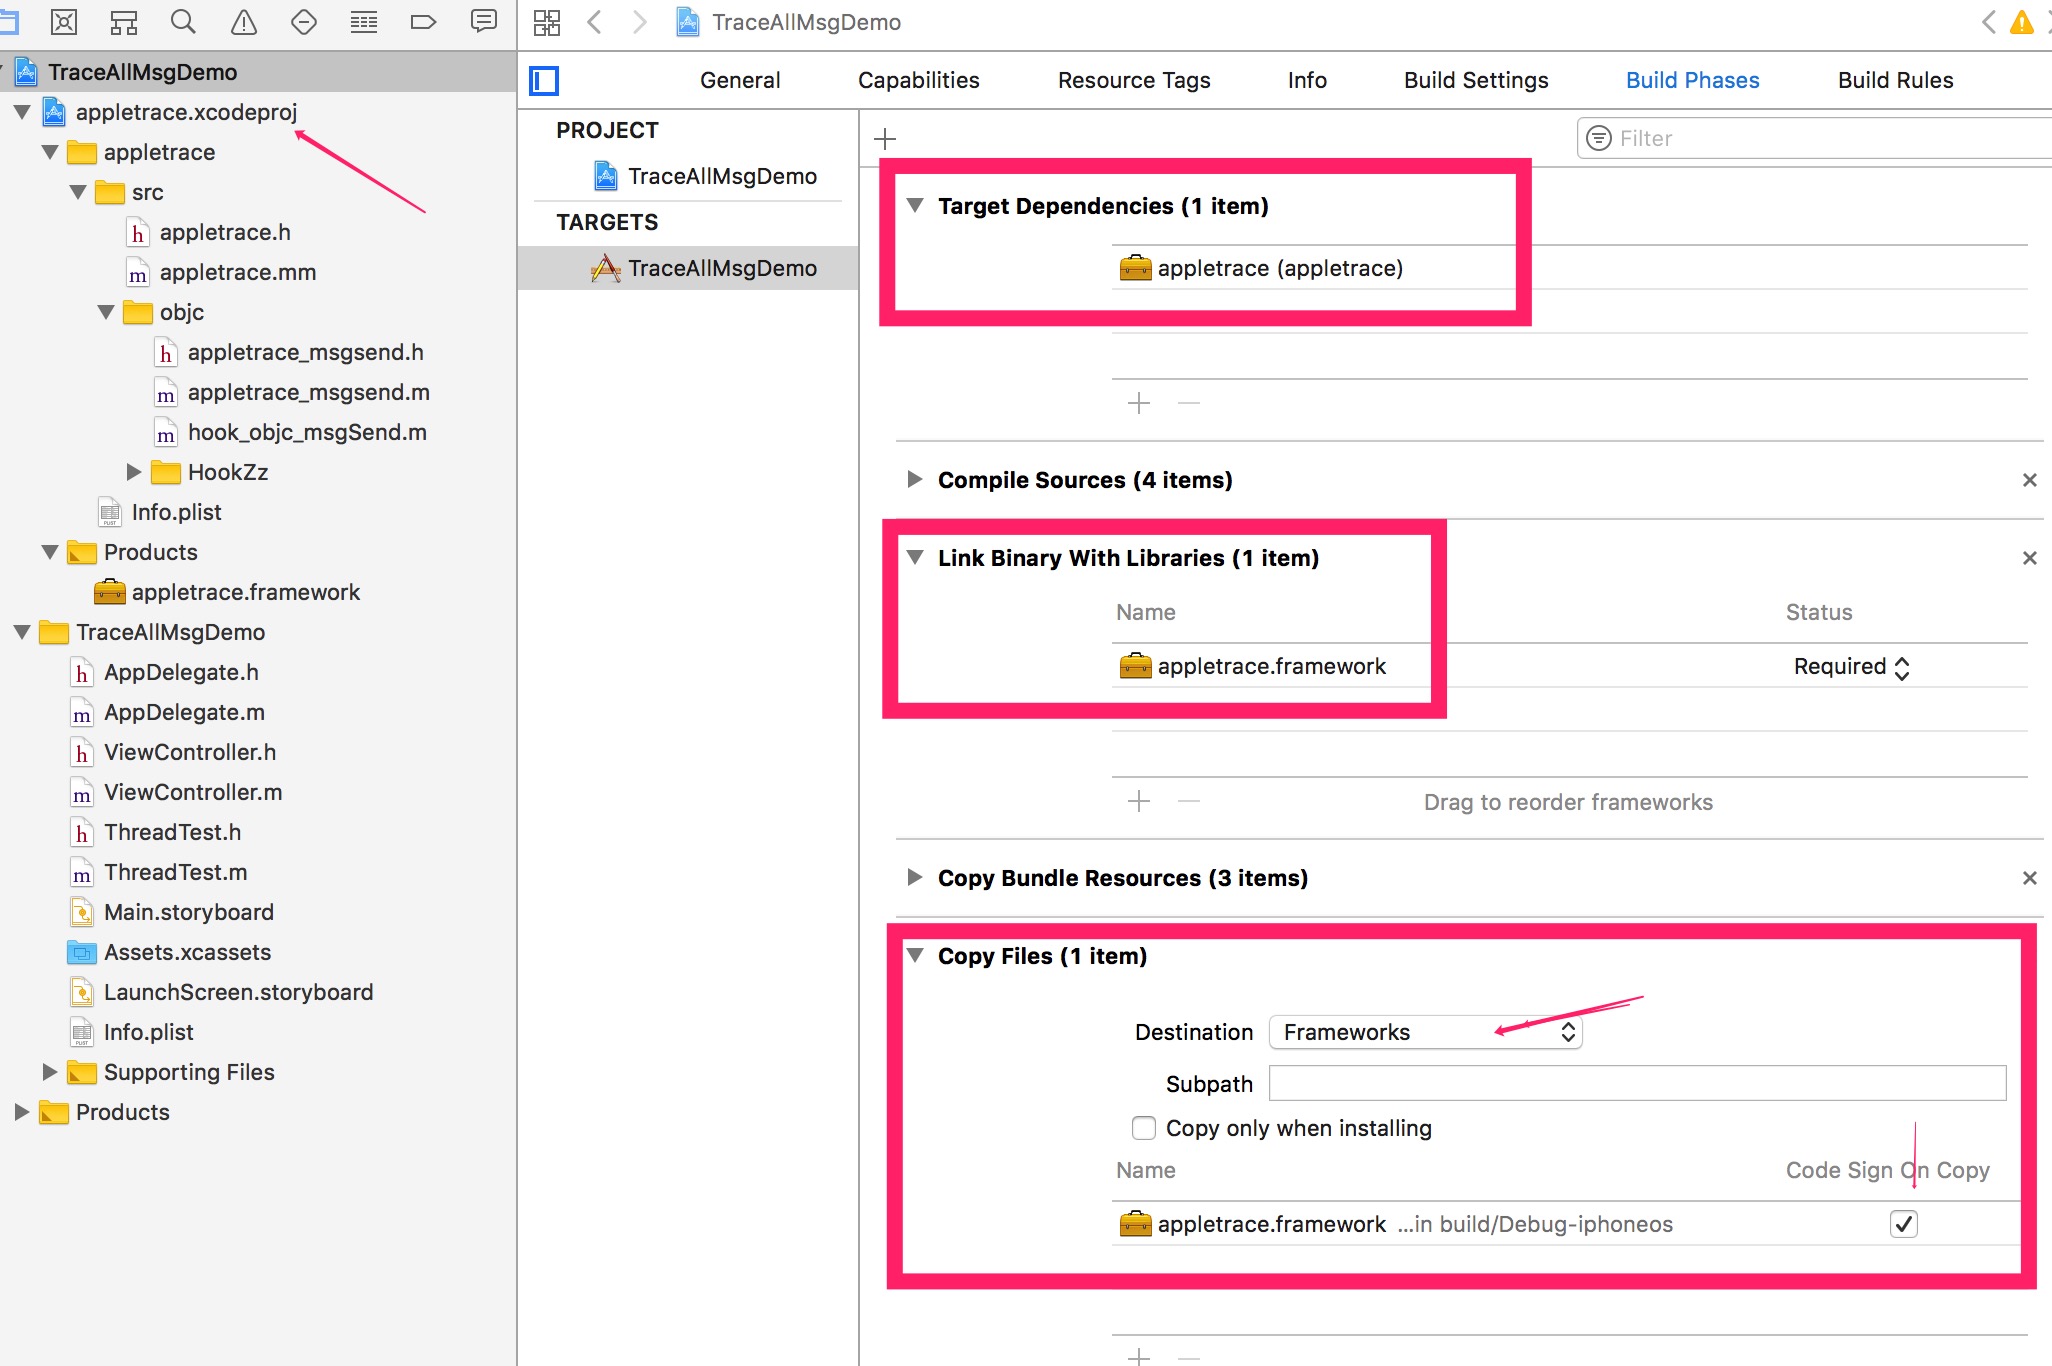
(1) Drag dynamic library’s project appletrace.xcodeproj into target project.
(2) And configure dynamic library’s dependencies Target Dependencies and Copy Files.
Reference sample/TraceAllMsgDemo.
Note:
- Need to disable BitCode.
- Only supports arm64.
Process Data, Generate html
Copy Library/appletracedata directory from App’s sandbox. (For example: Xcode can directly Dump entire sandbox)
Then,
// Process mmap log files
python merge.py -d <appletracedata directory>

// Generate html
python catapult/tracing/bin/trace2html appletracedata/trace.json --output=appletracedata/trace.html

// Open
open trace.html
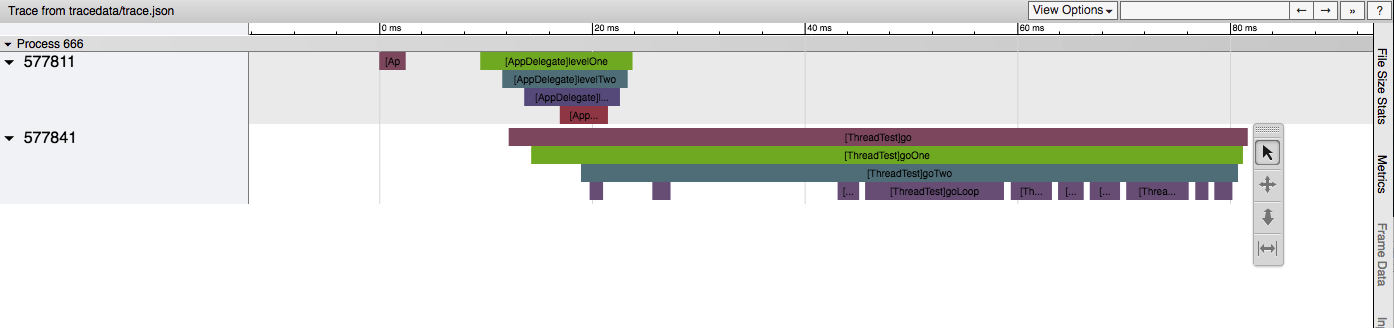
Can see
Performance Impact
Currently impact on App performance is mainly:
- Hook objc_msgSend: This is the main impact, so final generated results are only for analysis, comparison, and cannot think it actually consumed these values.
- Log file: To write logs, mmap’d file, also created queue. Also has impact on App’s own performance.
Limitations
Since HookZz’s hook of objc_msgSend only implements arm64 architecture, can only analyze on real device. (Of course this is enough, mainstream devices are arm64)
Plans
Plan 1: dtrace
For data generation source, currently there are two:
- Manual APTBeginSection and APTEndSection
- Hook objc_msgSend
Recently learned dtrace for a while, can completely use dtrace for simulator to generate data. dtrace is at kernel layer, has very little impact on App’s own performance, and dtrace not only can hook (trace) ObjectiveC methods, can also trace C methods, swift methods. This is next step’s plan.
Plan 2: Whitelist Classes/Blacklist Classes
Hook objc_msgSend method, some classes may not care about. Can use whitelist or blacklist method, narrow analysis scope.
Plan 3: Hook +load and C++ static initializers
See A method of hook static initializers and A method of hook objective c +load
Summary
This tool’s own code is not much (write logs), mainly combines catapult and HookZz, thanks again to catapult and HookZz.
Any questions welcome issue anytime, or contact my WeChat everettjf.