使用AppleTrace探索SpringBoard
前段时间的《初步探索LaunchScreen》使用IDA和lldb探索了下部分SpringBoard。这篇文章再用AppleTrace初步探索下SpringBoard。AppleTrace 目前使用了HookZz来inline hook objc_msgSend。可用于分析每个Objective C的方法耗时,和调用关系。
背景
AppleTrace 是大概去年(2017年)9月份业余时间开发(或者叫组装)的一个“性能”分析工具。“性能”是加了引号,因为本意是想用来分析性能,但由于对性能影响较大,结果只能拿来参考。或者说可以拿来分析方法之间的相对耗时。
以前写过三篇文章:
- AppleTrace 性能分析工具: https://everettjf.github.io/2017/09/21/appletrace/
- AppleTrace 搭配 MonkeyDev Trace任意App : https://everettjf.github.io/2017/10/12/appletrace-dancewith-monkeydev/
- 使用 Cydia 安装 AppleTrace Tweak : https://everettjf.github.io/2018/07/10/appletrace-tweak-cydia-repo/
哇,竟然写过三篇文章,AppleTrace真能凑数呀
前段时间的《初步探索LaunchScreen》使用IDA和lldb探索了下部分SpringBoard。这篇文章十分简单的介绍下怎么用AppleTrace探索SpringBoard。
地址是: https://github.com/everettjf/AppleTrace 。
当然写这篇文章的原由是因为,AppleTrace一直把catapult和hookzz当作submodule,但因为catapult仓库太大,导致初次下载以及切换分支时等待时间太长;hookzz的接口变动又太频繁,每次更新hookzz都要改代码。于是今天把这两个submodule删除了,找了一个可用的hookzz代码,把代码直接放进了仓库。
怎么做
1、使用MonkeyDev创建Tweak项目(例如CaptainHookTweak)
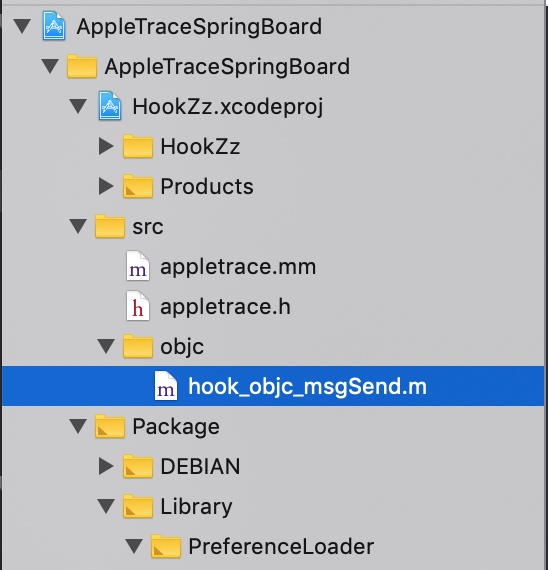
 2、把AppleTrace的objc_msgSend hook相关的文件拖入
3、 配置IP地址后,cmd+r就可以安装到越狱的手机上了。
4、 SpringBoard重启后就会自动记录所有Objective C的方法调用了。
5、 打开目录 /var/mobile/Library/appletracedata,由于SpringBoard的权限特殊性,获取Library目录的位置到了这里。
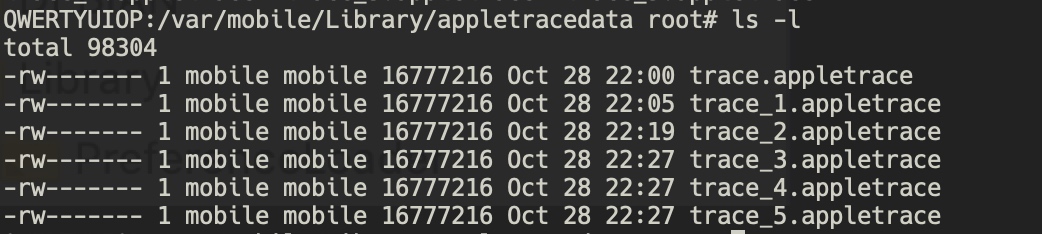
6、 复制出这些文件。
复制的方法很多。例如可以tar -zcvf x.tar.gz appletracedata/然后scp出来。
7、 使用AppleTrace的merge.py脚本处理成trace.json文件。
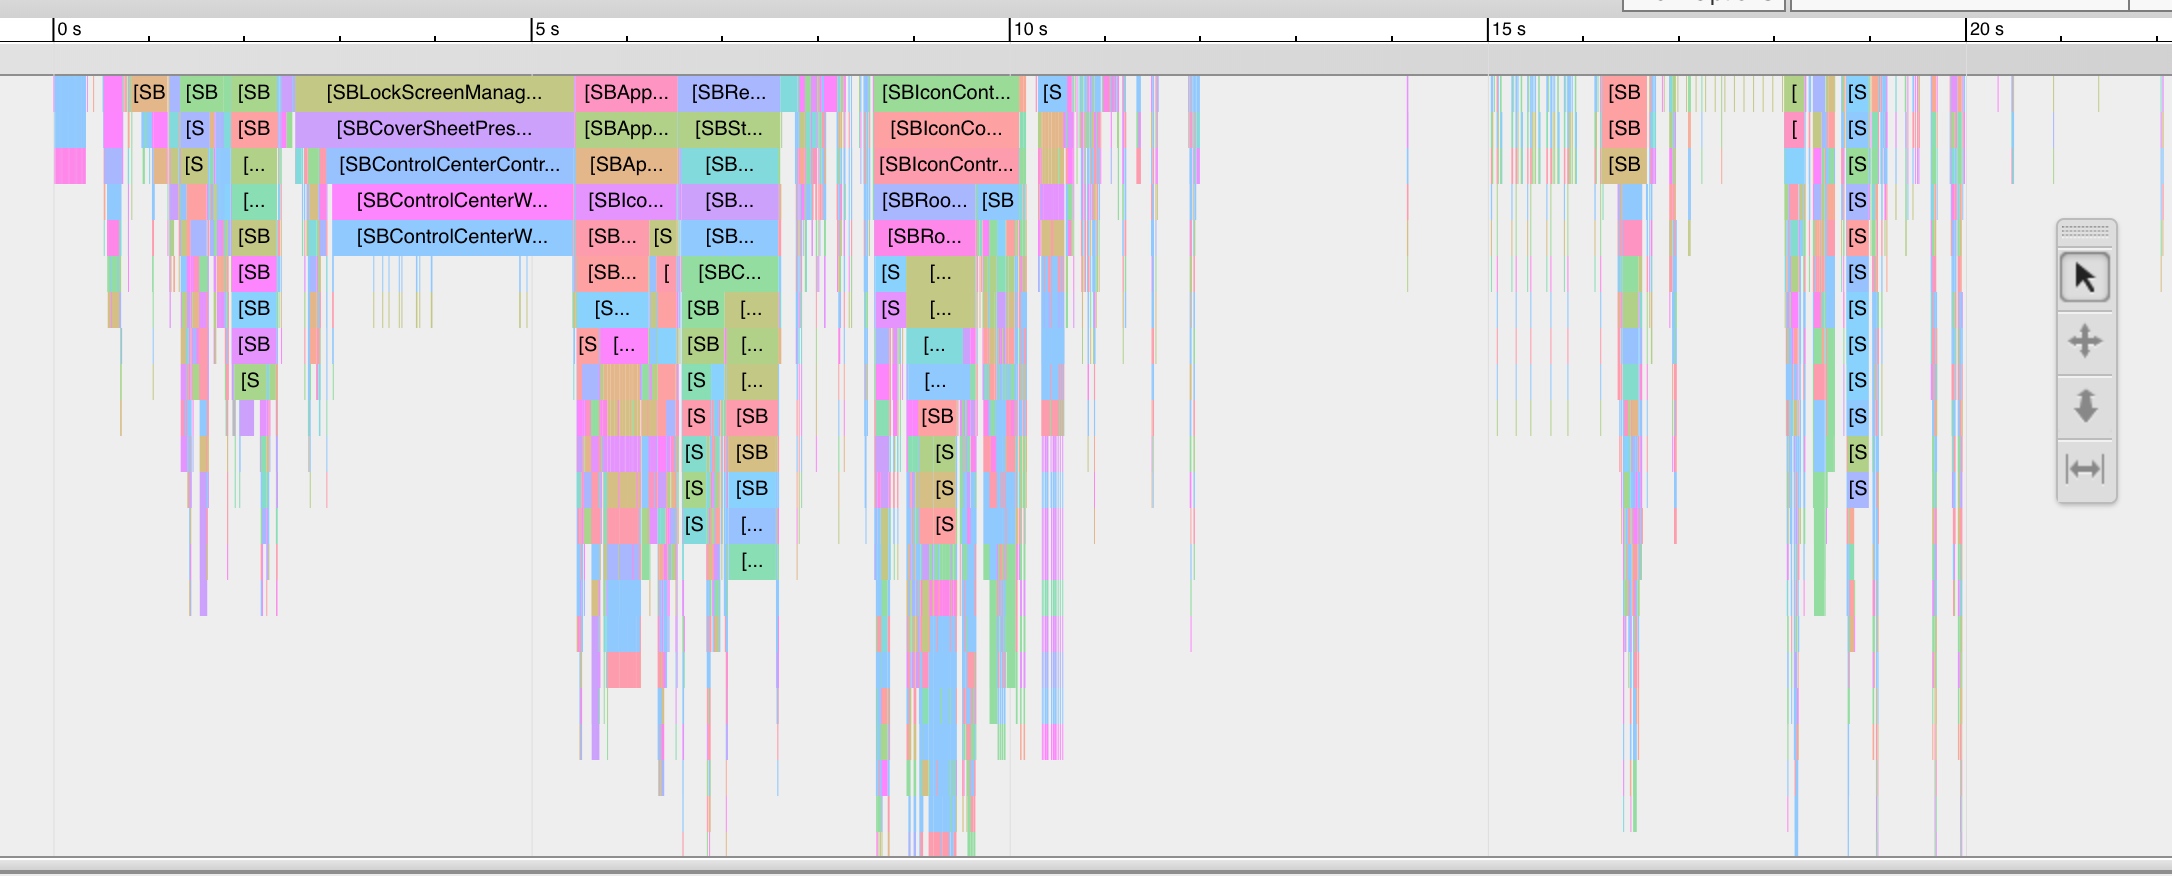
Chrome浏览器打开chrome://tracing,把trace.json拖入即可。
还有什么
由于目前的代码会(尝试)主动过滤一些“非当前可执行文件”的方法,目前看到基本都是SB开头的类。
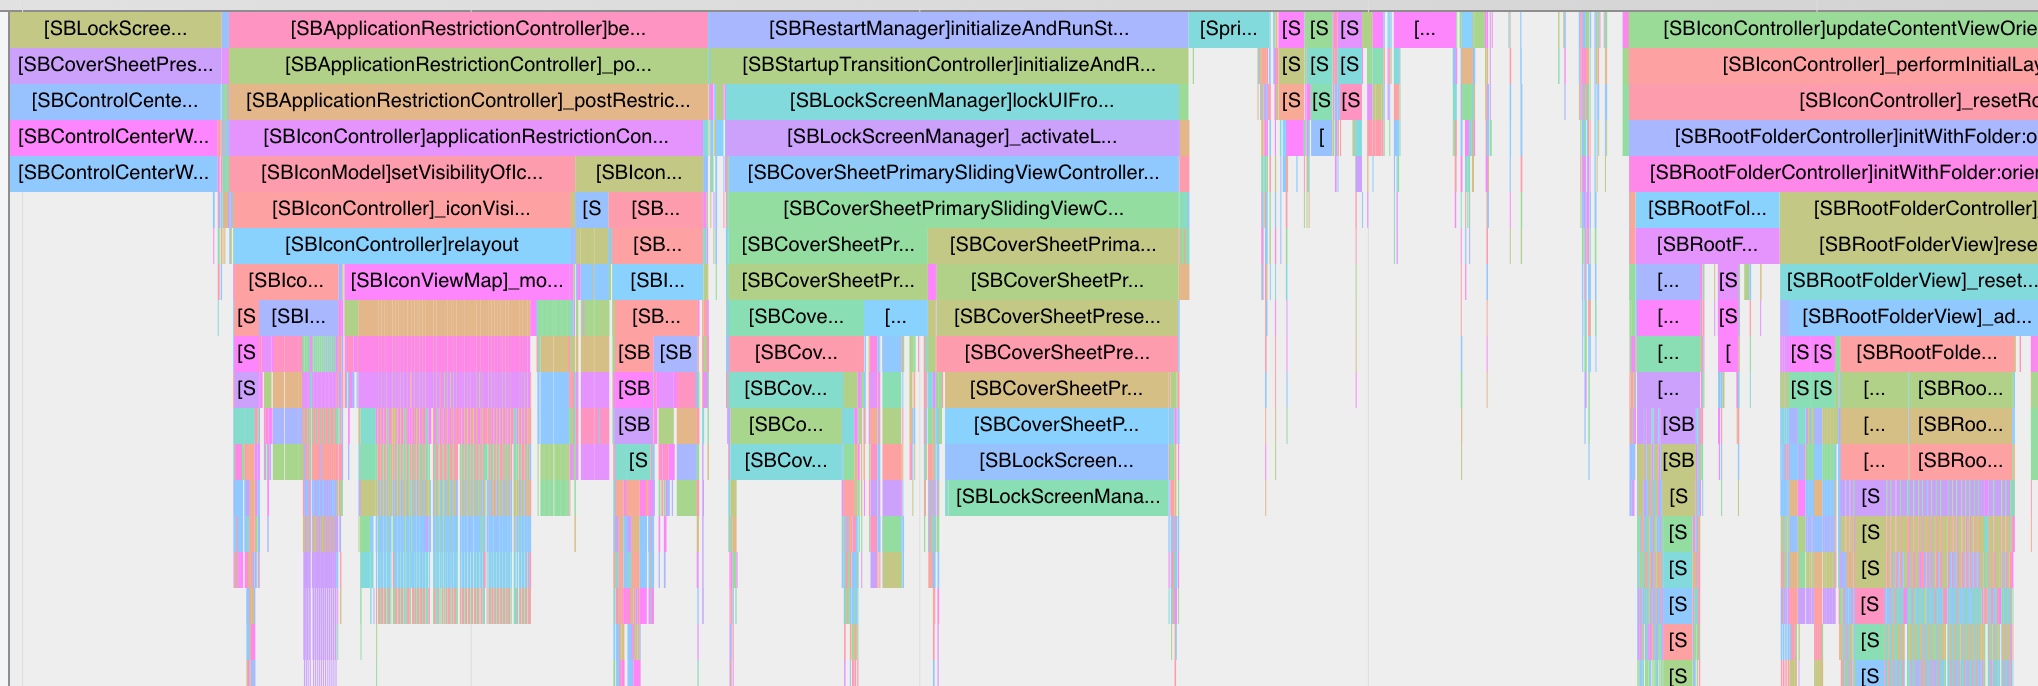
真实满屏幕的SB啊 :) 很提神
下一步可以扩大范围,不过滤或者少过滤。具体代码可见:
上面SpringBoard的trace.json见:https://github.com/everettjf/Yolo/tree/master/BukuzaoArchive/stuff/appletracedata.tar.gz
其他App
SpringBoard我们能Trace,其他App更是可以了。可以参考过去的文章,如何Trace任意App。
总结
这篇文章很简短,主要广而告之下AppleTrace也是一个探索的工具,很有意思。